Creating Custom Reports
You have the ability to use BI Reporting to create completely new custom reports. You begin with a blank report, and choose the Data Views, determine the relationships (Join) between that data, and select the filters and parameters for the end results.

|
You may find it easier to customize a standard report, and then edit that report to see how Oracle created the Joins and Conditions for the Data Views to obtain the standard output. All of the functionality presented here is also available by editing customized standard reports. To do this, make a change to a standard report, by selecting fields or sort orders other than the pre-selected defaults, give the report a Custom Report Name, and save it. It is saved as a Custom Report. Next, locate the Custom Report you just created, click  , and then select Edit Report. It will open using the wizard discussed in this section. , and then select Edit Report. It will open using the wizard discussed in this section.
Note: Only standard text for parameters will be localized.
|
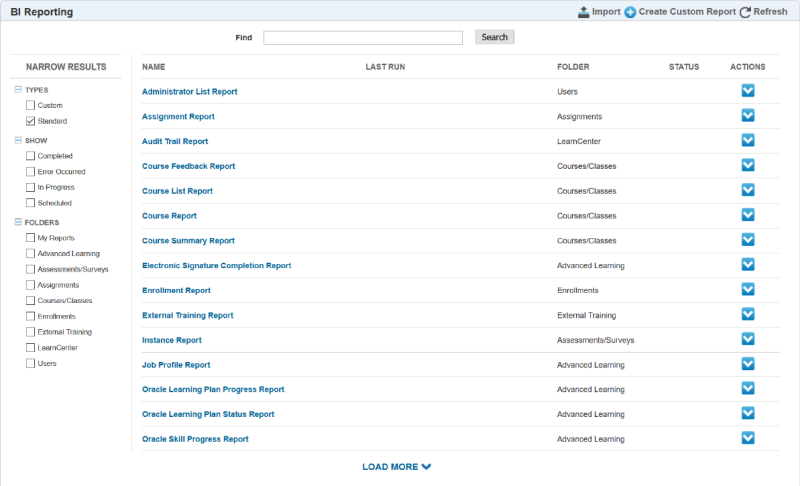
To access the Custom Report Wizard, click the Create Custom Report icon on the BI Reporting page.
The Wizard contains 8 steps.
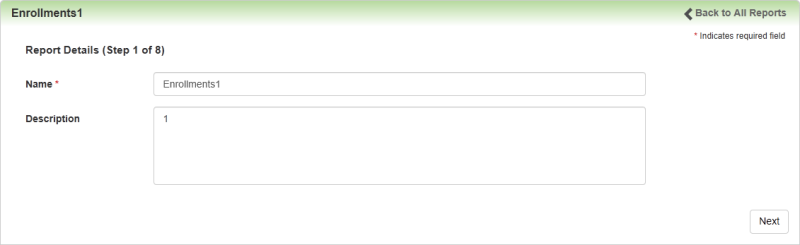
In the first step, type a Name (required, up to 250 characters) and Description (optional, up to 1000 characters) for the report. Click Next.
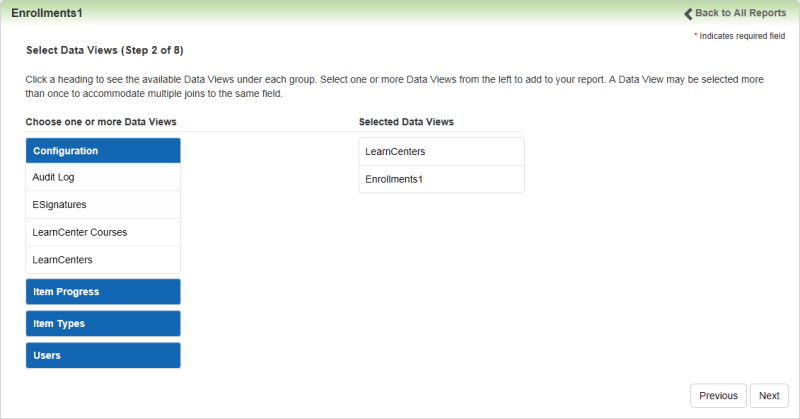
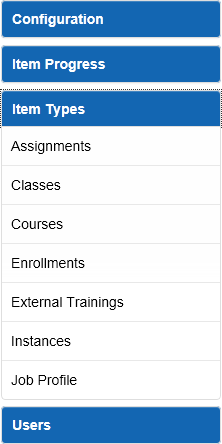
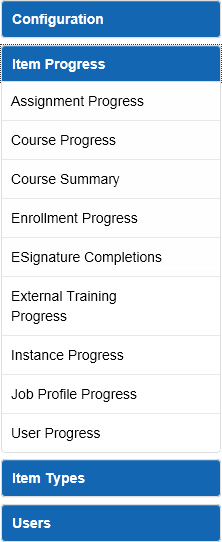
Step 2 contains the available Data Views that you can select from for the report. The Data Views are logically grouped and listed under appropriate titles. Click a blue title bar to display a group of related Data Views. For example, if you click Item Types, you will see the following related Data Views:
If you click Item Progress, you will see the following related Data Views:
To select Data Views for the report, move them to the Selected Data Views area of the page by any of the following means:
- Double-clicking the Data View.
- Clicking the
 icon that displays when you rest your pointer on a Data View.
- Dragging and dropping the Data View.
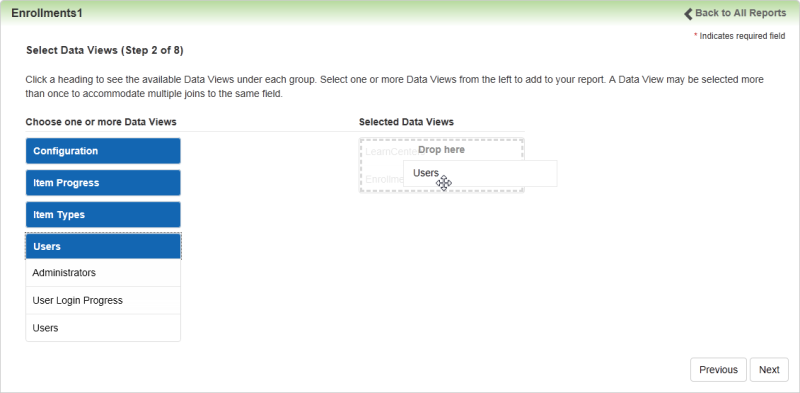
You can add the same Data View more than once if necessary for your report, up to 10 Data Views per report.
Conversely, you can remove Data Views from the Selected Data Views area by clicking the  icon that displays when you rest your pointer over the Data View. If you want to know more about what is contained in a Data View before you select it, rest your pointer over it and click
  .
.
Click Next.
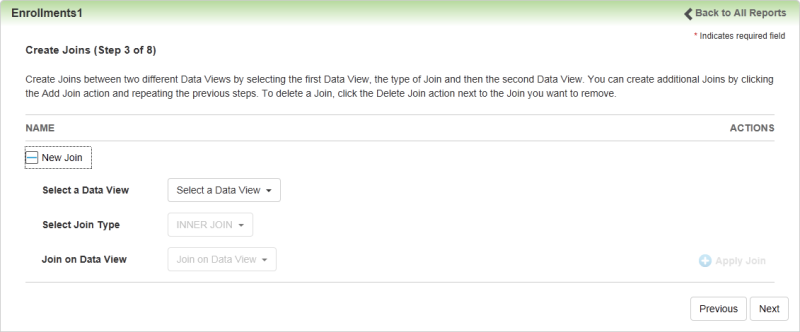
Use Step 3 to create "Joins" between the Data Views you selected in Step 2. Each Data View you added in Step 2 must be part of at least one Join. When you create a Join you are telling LearnCenter to compare two Data Views to look for values that either match or do not match (depending on the intended purpose of the report). The process of creating Joins works in the following manner:
- You added 3 Data Views: A, B and C. You want to compare Data View A with Data Views B and C to look for values in Data Views B and C that match or do not match values in Data View A.
- When creating the first Join, select any one of the 3 Data Views to Join to the remaining 2.
- When creating the second Join, you must choose 1 of the 2 Data Views joined in Join 1, and then pick the third topic.

|
Deleting a Join will delete all Joins underneath it, since a relationship "chain" has been built. |
- Select the first Data View.
- Select one of the following Join Types:
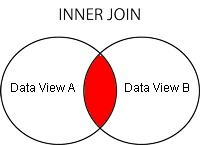
- Inner Join - requires each record in the two joined Data Views to have matching records.
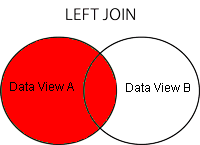
- Left Join - The result always contains all records of the "left" Data View, even if the Join-condition does not find any matching record in the "right" Data View (B).
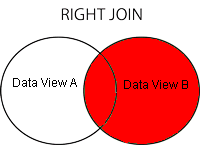
- Right Join - The result always contains all records of the "right" Data View, even if the Join-condition does not find any matching record in the "left" Data View (A). Every row from the "right" Data View (B) will appear in the joined Data View at least once. If no matching row from the "left" Data View (A) exists, NULL will appear in fields from A for those records that have no match in B.
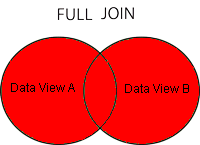
- Full Join - combines the effect of applying both left and right outer Joins. Where records in the full joined Data Views do not match, the result set will have NULL values for every column of the Data View that lacks a matching row. For those records that do match, a single row will be produced in the result set (containing fields populated from both Data Views).
|
|
Recommended reading on how Joins work: http://www.w3schools.com/sql/sql_join.asp.
Refer to the BIP Data Views Schema Diagram document, available on Customer Connect, for Oracle Learn Cloud recommended Joins between the Data Views.
|
- Select the second Data View.
- Click Apply Join.
- Repeat these steps until you have created all of the Joins you want. You must have at least one Join for each Data View.
|
|
Best Practice: Limiting the number of Data Views and Joins will typically result in better performance for BI Reporting. As a best practice, only include Data Views that you need or plan to use, and use Join fields appropriately. The BI Reporting system is not designed to be used as a data extraction tool. |
- Click Next.
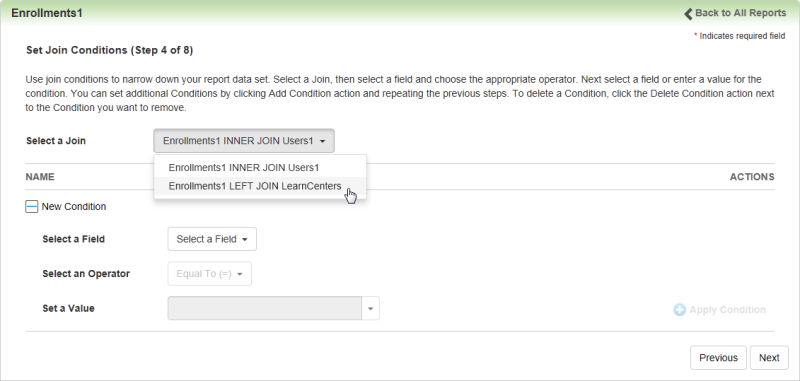
In Step 4, identify the relationship you are looking for between the joined Data Views by selecting Join Conditions. You can have as many Conditions as you want, but every Join you added in Step 3 must have at least one Condition.
- Select one of the Joins you created in the previous step from the Select a Join drop-down list.
- Select a field from the Select a Field drop-down list. This drop-down list contains all possible fields for the Data Views involved in the Join.
- Select the appropriate operator from the Select an Operator drop-down list.
- Select the appropriate value from the Set a Value drop-down list,
or
Type your own values here. This field accepts the following SQL Wildcards:
| % |
Any string of zero or more characters. |
WHERE title LIKE '%computer%' finds all fields with the word 'computer' anywhere in the field text.
|
|
_ (underscore)
|
Any single character |
WHERE au_fname LIKE '_ean' finds all four-letter first names that end with ean (Dean, Sean, and so on). |
| [ ] |
Any single character within the specified range ([a-f]) or set ([abcdef]).
|
WHERE au_lname LIKE '[C-P]arsen' finds Ulast names ending with arsen and starting with any single character between C and P, for example Carsen, Larsen, Karsen, and so on. In range searches, the characters included in the range may vary depending on the sorting rules of the collation. |
| [^] |
Any single character not within the specified range ([^a-f]) or set ([^abcdef]). |
WHERE au_lname LIKE 'de[^l]%' all User last names starting with de and where the following letter is not l. |
- Click Apply Condition.
- Click Next.
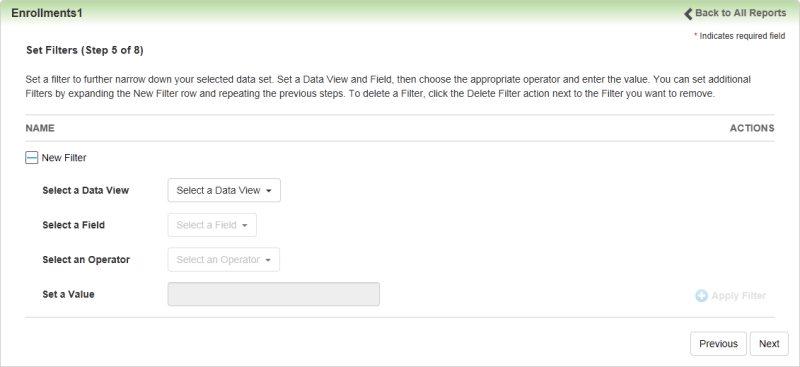
Use Step 5 to set Filters to further narrow down your data sets. Filters are optional, hidden parameters that enable you to filter out some of the data before you build the report. This lets you prevent your end-Users from seeing some of the available data. For example, you can filter a report to use only data from a particular sub LearnCenter so that the User who will be running the report only sees data from that sub LearnCenter as a selection when running the report.
- Select the values you want.
- Click Apply Filter.
- Click Next.
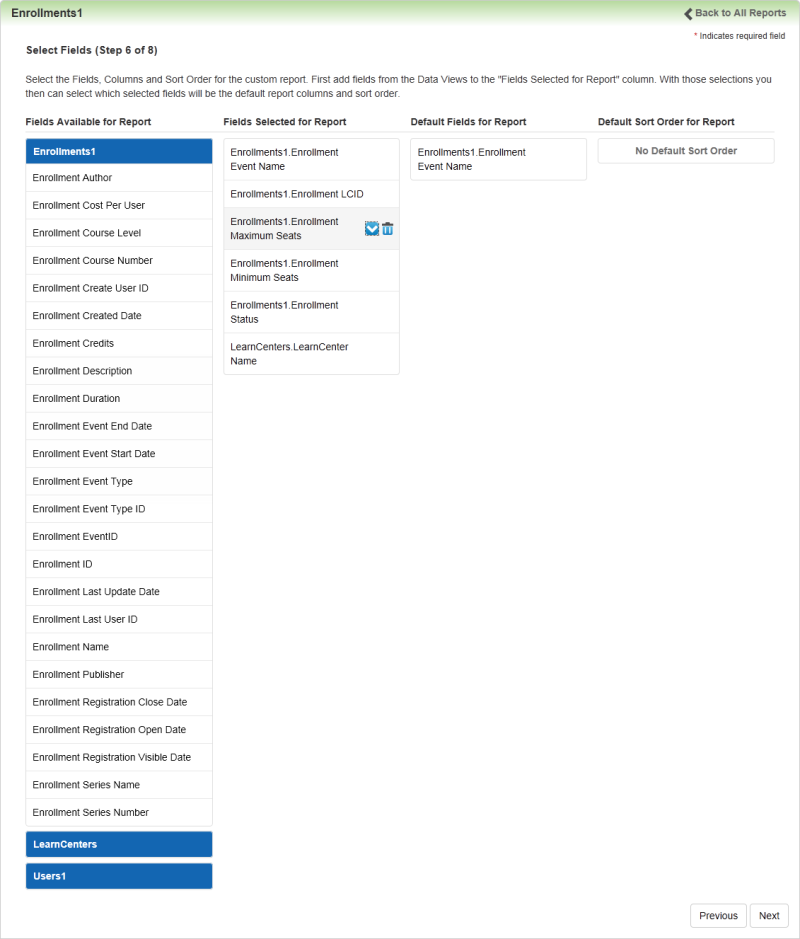
Use Step 6 to select the fields that you want to make available for the report, and select the default sort order. You can have as many fields as you want, although SQL does have a limitation of 4096 fields. What you select here will display on the Fields tab when you run the report.
- Add fields from the Data Views to the Fields Selected for Report column. You can move fields around by dragging and dropping just like you did in Step 2.
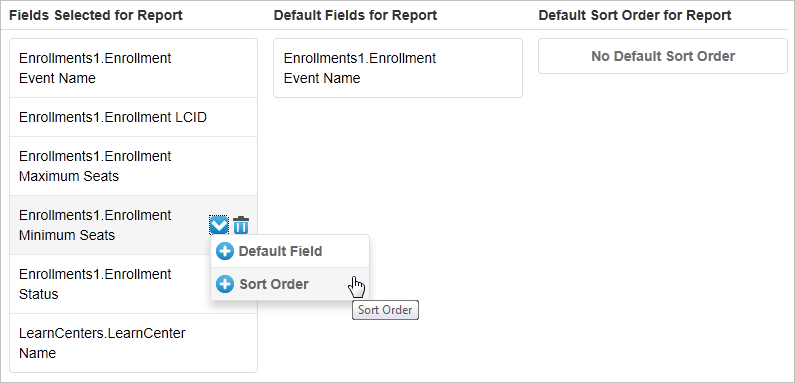
- Select which of those fields will be the default report columns and the default sort order by resting your pointer over the item and selecting the appropriate choice from the drop-down list.
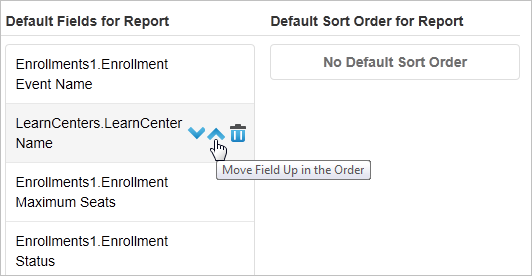
- Move items up and down in the list by using the arrows that display when you rest your pointer over an item.
- Click Next.
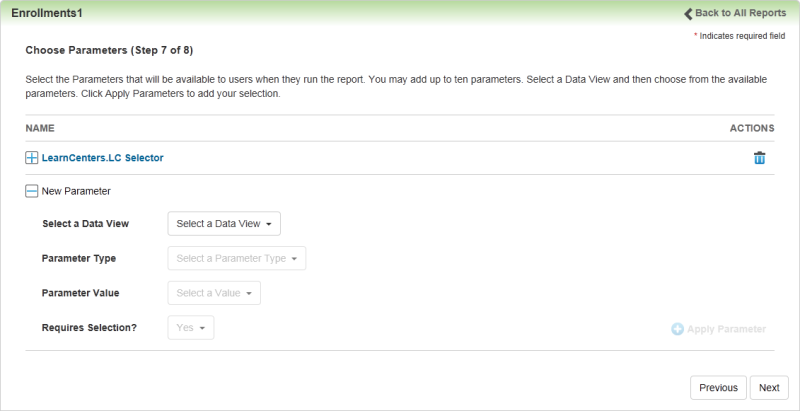
Use Step 7 to select the Parameters that you want to make available to Users when they run the report. You can add up to 10 parameters. What you select here will be available on the Users (if applicable) and the Parameters tabs when you run the report.
|
|
Best Practice: At a minimum, select the LearnCenters you want Users to have access to. If you do not specify a LearnCenter, Users will have access to all data in all LearnCenters, regardless of whether they have access to those LearnCenters. |
- Select a Data View from the Select a Data View drop-down list.
- Choose from the available parameters.
- Click Apply Parameters to add your selection.
- Click Next.

|
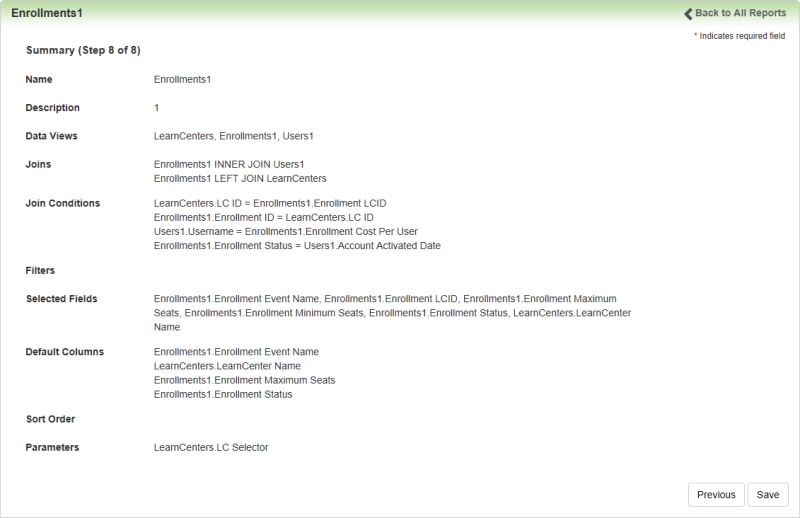
None of your work is truly saved until you click Save in Step 8. Clicking Back to All Reports at any time before you click Save will cause you to lose your changes.
Best Practice: Copy and paste the contents of Step 8 into a text file or Microsoft® Word document, and keep that document on hand in case you make changes later and want to revert back to your original settings.
|
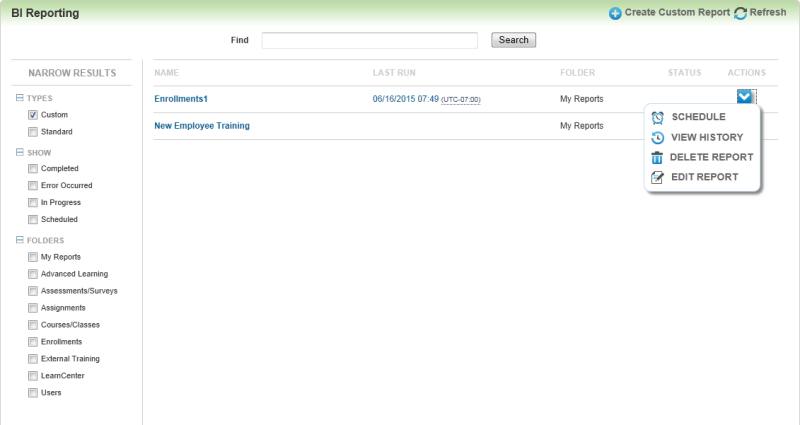
You can run, schedule, view, delete and edit the report. (The actions that display here depend on BI Reporting User Permission settings.)

|
The Edit action is not available if a report has an active schedule. This is to prevent you from potentially adding new required parameters for which the scheduler has not accounted, which could cause the report generation to fail. If you need to edit a scheduled report, first clear the schedule settings, then edit the report, and then recreate the schedule.
When Editing a report, if you remove some of the original Joins or parameters, you will be forced to redo the remaining steps of the report wizard.
|
Steps to Enable
You must grant the appropriate User Permissions, including the Create & Edit Reports User Permission in order to use this feature.
 Related Topics

Copyright © 2010-2018, Oracle and/or its affiliates. All rights reserved.